A variety of options exist to start and stop the profiling functionality built into Content Server. The events recorded are identical regardless of which method is used.
Unexpected behavior and invalid profiling data may be generated if you enable the profiler using more than one method simultaneously, for example, if you enable the profiler from a script within CSIDE on a system where the profiler is also enabled via the opentext.ini file. To prevent this, CSIDE disables the menu options to enable the profiler when CSIDE detects that the profiler is already running.
As documented in the Content Server System Administration Guide, you can add "Profile" and "ProfileFormat" lines to the [general] section of opentext.ini. This will enable the profiler for all OScript function calls,and optionally, builtin calls, made while the server is running.
For example, adding the following lines to the [general] section will result in the profile recording function and builtin activity in files in the logs directory named profile-<process_id>-<thread_id>.csv:
Profile=2
ProfileFormat=out.csv
The OScript language provides a profiler builtin function which allows you to enable and disable the profiler programmatically. For example, adding the following lines to a section of code in OScript will result in all function activity between the two lines getting recorded to C:\profLog.out:
Profiler.Start("C:\profLog.out", Profiler.LEVEL_CALLS, true)

        [...]

Profiler.Stop()
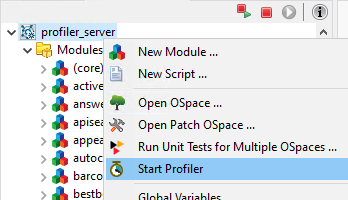
Once the server is running from within CSIDE: right-click the server object to open a menu that includes the option Start Profiler. Click Start Profiler to record all OScript calls made on the server:

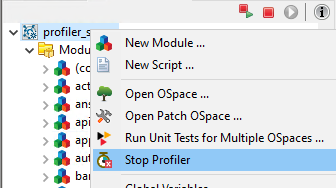
To stop the profiler right-click the server object again and select Stop Profiler:

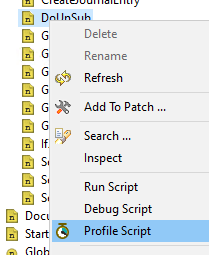
You can enable the profiler to run against specific scripts. The profiler automatically turns off when the script execution completes. Right-click the script and select Profile Script:

This option is available wherever the existing Run Script and Debug Script options are found. Similar to the run & debug script options, you cannot choose this option for a function that requires parameters. These menu options do not allow you to enter parameters.
Because parameters cannot be provided to a function with this option, to profile a specific request handler, wrap the request handler's Execute() function with Profiler.Start() & Profiler.Stop() builtin calls. To enable this profiling on a remote / customer system: export this code change to a patch.
Content Server's profiler can record statistics for builtin calls in addition to function calls. When starting the profiler via CSIDE, set the "Include builtin calls when profiling" preference option.
When you use CSIDE to enable the profiler the file format is CSV. These files are saved to the ".metadata\.plugins\com.opentext.cside\profileData" folder within Eclipse's workspace. The files remain there until you manually remove them, unless you have enabled the Remove the profiling files from disk when removed from History preference.
The CSV file has six columns: call depth, function name, line number, start time, end time, and duration:
Rows are added to the CSV file when all of the above fields become available. This means that all of a function's child calls are listed before the function itself.
Example:
function void a()
   b()
   c()
end

function void b()
  d()
end

function void c()
  e()
  b()
end
The call graph for the example above appears as the following in the CSV file:
call depth,function name
2,d
1,b
2,e
3,d
2,b
1,c
0,a