 ) opens a file dialog which allows you to locate and open a CSV file stored on the workstation. By default, CSV files are split up by request (You can change this behavior by setting the Split collected profile data by request preference).
Once CSIDE has completed capturing profile, data Eclipse shows the "Profiler Data" view.
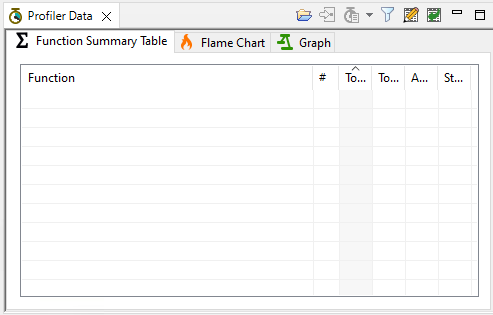
To open this view manually, in Eclipse click Window → Show View → Other.... This view provides three sub-views on tabs:
Click an entry in the Function Summary Table or Flame Chart to select that function, which in turn changes the display of data in the flame chart and graph views (more on this in the respective sections below).
The following toolbar options are available for all three view types:
The Open Profiler File... button (  ) opens a file dialog which allows you to locate and open a CSV file stored on the workstation. By default, CSV files are split up by request (You can change this behavior by setting the Split collected profile data by request preference).
The Show Profiler File in System Explorer button (  ) shows the currently viewed profile file within the operating system's directory structure. If no data is currently available this option is disabled.
The Show Profiling Captures... button (  ) allows you to open previously captured / loaded profile data that is still in memory.
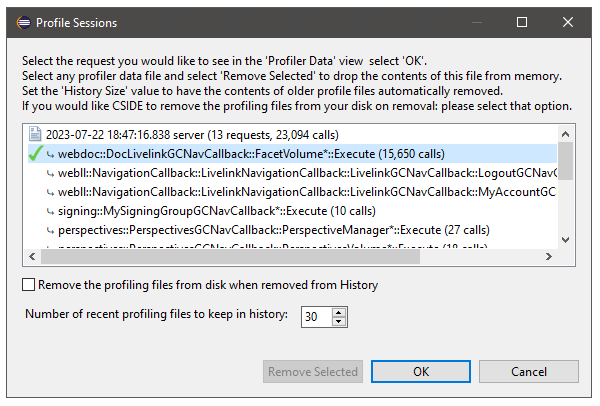
This dialog allows you to select a request to display in the view. A check mark icon ( ) indicates the currently displayed request. A file icon (
 ) indicates the CSV file. The requests contained in the CSV file appear below the CSV file name. If the Split collected profile data by request preference was disabled when the CSV file was loaded, or if the CSV file only contains one request, the CSV file entry represents both the file and the contained request.
By default, CSIDE keeps the last 30 profile files in memory. When a profile file is removed from memory, either by the user or the limit mentioned here, the file remains on disk. Options to change these behaviors also exist in this dialog. These options are also available on the profiler preferences page.
Alternately, you can navigate through the various data files and requests on the drop-down menu next to the contextual menu button:

The Function Summary Table tab allows you to view statistics on each function / builtin recorded. Each row contains data on a unique function / builtin. For example, all calls to DAPI::GetNodeByID will be collected into the same row.
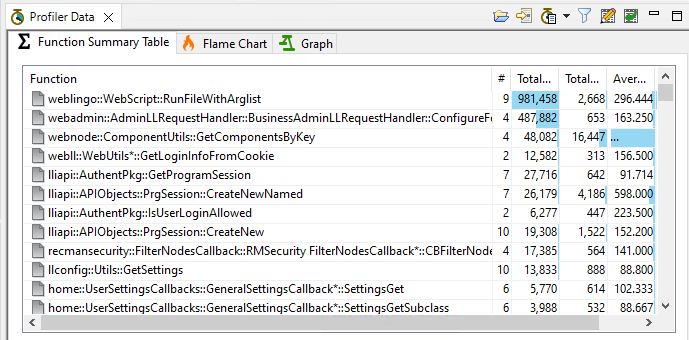
The columns available for display include:
All times for metrics are in microseconds. The default selections are Function Name, Invocation Count, Total time in function, Total time in function (minus callouts), Average time in function, and Standard deviation for function (minus callouts). If an entry in the Function name column includes a  icon, that row represents a function. Rows without this icon are bultins. Non-name columns include a blue bar in their background that shows the row value relative the maximum value for that column
To change or reorder the columns displayed, click the Show / hide columns... button (  ). The following dialog opens.
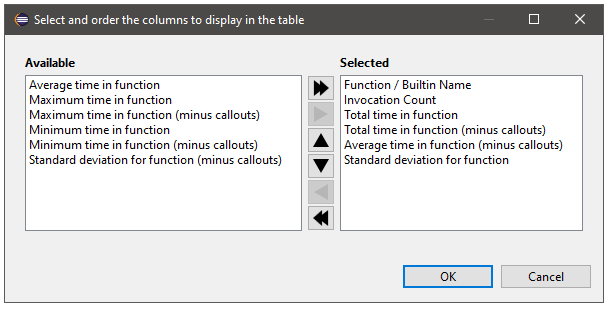
In addition to selecting which columns are displayed, you can filter out rows by selecting the Filter rows ... button  . The following dialog opens.
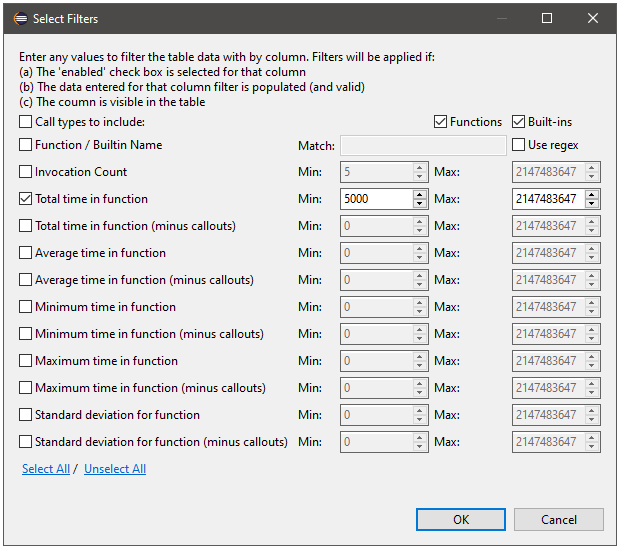
To filter out rows based on that row's column, the column must be selected for display in the table, the check box on the left side of the column must be selected in this dialog, and the filter value must contain a valid value. Most filterable columns are metric-based, and so the filter value is simply an integer range. Valid values are from 0 to 2,147,483,647. However, there are two non-metric columns that can be filtered on:
Applied filter criterion are displayed in a list at the top of the table, along with an Edit... button. The edit option does the same thing as the  button.

To sort a column, click the column header. To sort the same column in reverse order, click the column header again. To rest and optimize the column width, click the Reset column widths button  .
.
The Flame Chart tab displays individual requests over time (x-axis) and stack depth (y-axis).
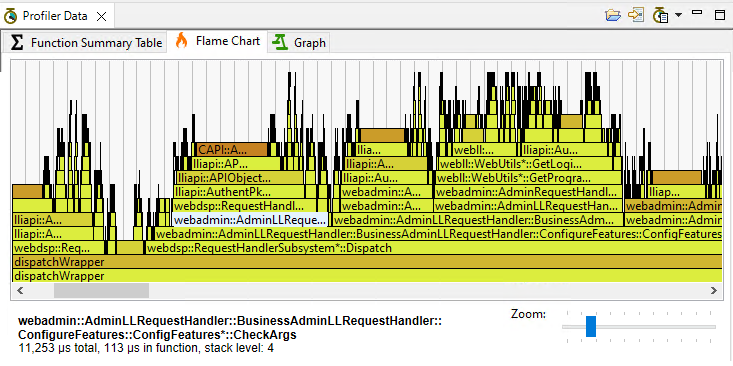
Things to note about the Flame Chart:
One pattern of interest that this chart demonstrates is the likely iteration over a data structure, which appears as a 'picket fence' in the graph:

In the example above, you can see the function called HasBusinessAdminPrivilege in turn calls GetPrivileges, which in turn iterates over a list of 50 objects. When this sort of pattern is seen it is possible, though not guaranteed, that more direct access to the data structure would reduce execution time.
The Graph tab shows the call relationships between the functions seen by the profiler. This view is largely the same as KCacheGrind's "call graph" view.
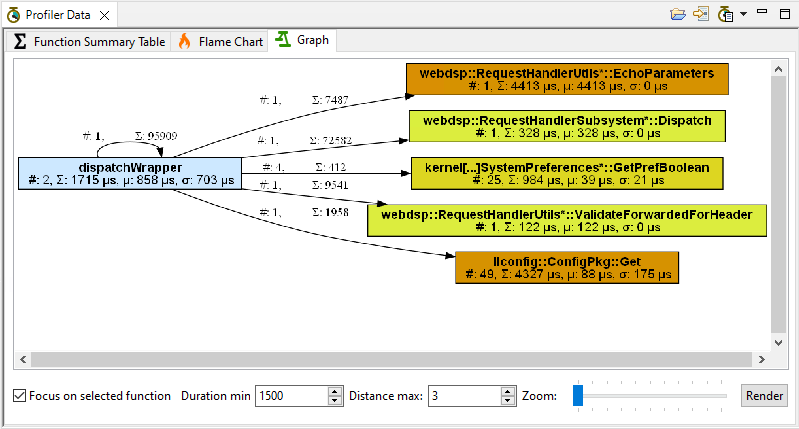
The rendering of this image is done using an open source application called 'dot', from the Graphviz project. OpenText does not distribute this application with CSIDE. To make use of this view, download the dot binary and point CSIDE to this by setting the [optional] location of the 'dot' executable profiler preference.
Things to note about the Graph tab: